Talking Points:
- EUR/USD Rises on German GDP Data
- Daily Resistance is Found at 1.0669
- Looking for additional trade ideas for the EUR / USD ? Read our 2017 Market Forecast
The EUR/USD is trading back towards key points of daily resistance, after German GDP figures beat expectations this morning. German GDP (YoY) was expected at 1.8%, but released at 1.9%. This move has now led to a two day rally for the pair spanning 231 pips.
Technically the EUR/USD is trading higher, but quickly running into resistance. As seen in the graph below, the pair is currently testing a 61.8% Fibonacci retracement level found at 1.0669. This measurement has been found by taking the distance between the December 8th high at 1.0873 and the January 3rd low at 1.0340.
EUR/USD, Daily Chart with Fibonacci Resistance
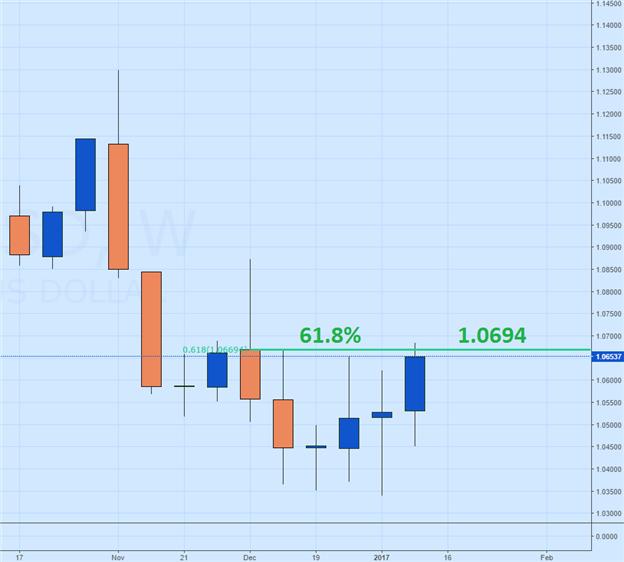
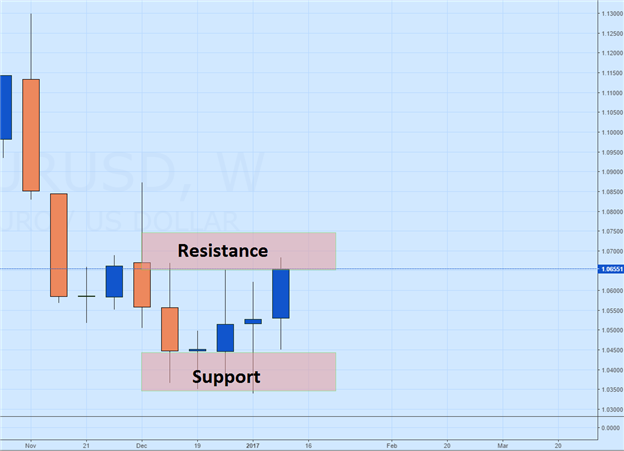
If the pair remains below resistance, it may suggest that the EUR/USD is trading in an ongoing range. The Fibonacci line at 1.0669 runs firmly through a zone of resistance, which is comprised of a series of wicks on the daily chart. A turn near present prices may suggest that the EUR/USD may move back towards a zone of support found beneath 1.0400. Traders may reasonably expect this range to continue until a breakout is confirmed on the daily chart.
If a breakout does occur, traders may find initial bullish and bearish targets using a 1x extension of the identified range. Currently the range measures 344 pips from its support and resistance extremes. This means bullish targets may begin near 1.1028, and bearish targets at .9996.
To Receive Walkers' analysis directly via email, please SIGN UP HERE
See Walker's most recent articles at his Bio Page .
Contact and Follow Walker on Twitter @WEnglandFX.