Student' s Question: Not sure how I can use this trendline that I drew on this chart to enter the trade…help! Instructor' s Response: Based on this USDCAD Daily chart we know that we only want to look for opportunities to short this pair as it is in a downtrend.
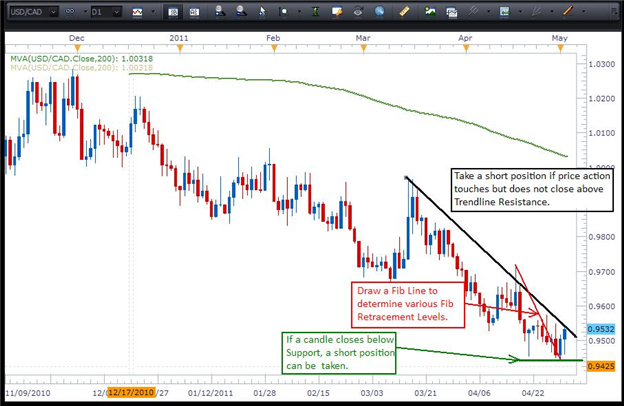
Based on the Daily chart you posted, there are three things that can be used to analyze the trade and determine our entry: 1) if the pair trades up to the black trendline you have drawn, a short position can be taken as long as the candle body does not close above the trendline; 2) put a Fib line (red line) as shown and from the Fib levels a trader can determine the potential level of retracement. Once that level is hit, a short position can be taken at the Fib level where price action stalls; and, 3) if the pair closes below support (green line) a short position can be taken at that point since a new low has been created.The idea here is that there is more than one way to analyze a chart relative to what is going on with the pair. The main thing is that no matter what the signal, we only want to take trades in the direction of the Daily trend as those will be the higher probability trades.