- Trade War 2.0 may trigger a stagflation narrative as it involves not only US-China trade but with other major trading partners.
- Commodities currencies may face further headwinds due to deteriorating global economic growth prospects.
- Watch the 0.6330 key medium-term resistance on the AUD/USD and the 1.4300 key medium-term support on the USD/CAD.
On 1 February, US President Trump officially “fired” his flagship trade tariffs policy by imposing 25% tariffs on goods from Canada and Mexico and a 10% levy on products from China via the issuance of executive orders.
While tariffs-related orders have not been executed on European Union exports to the US, Trump has remarked that trade tariffs will “definitely happen” on European goods, which sparked a sell-off in the Euro and European benchmark stock indices today; the EUR/USD tumbled by 1.2% to revisit its recent 13 January swing area of 1.0190 and export-dependent Germany’s DAX shed 1.7%
Trade War 2.0 is different from the US-China Trade War which was enacted in January 2018 in terms of coverage as this time round it involves major trading partners of the US, on top of the ongoing US-China Tech War.
Trade War 2.0 May Trigger Negative Whiplash on Commodities Currencies
Hence, it may trigger a widespread negative sentiment on global growth prospects, risk of stagflation narrative may be back on the radar of speculative players in the financial markets which in turn creates a negative feedback loop on higher beta commodities related currencies that has a direct correlation to global economic growth such as AUD (base metal proxy such as iron ore ), CAD (oil proxy).
Let us do a deep dive into the prospects of the Aussie dollar and Loonie from a technical analysis perspective over a medium-term horizon (multi-month).
AUD/USD Negative Reaction at 50-Day Moving Average

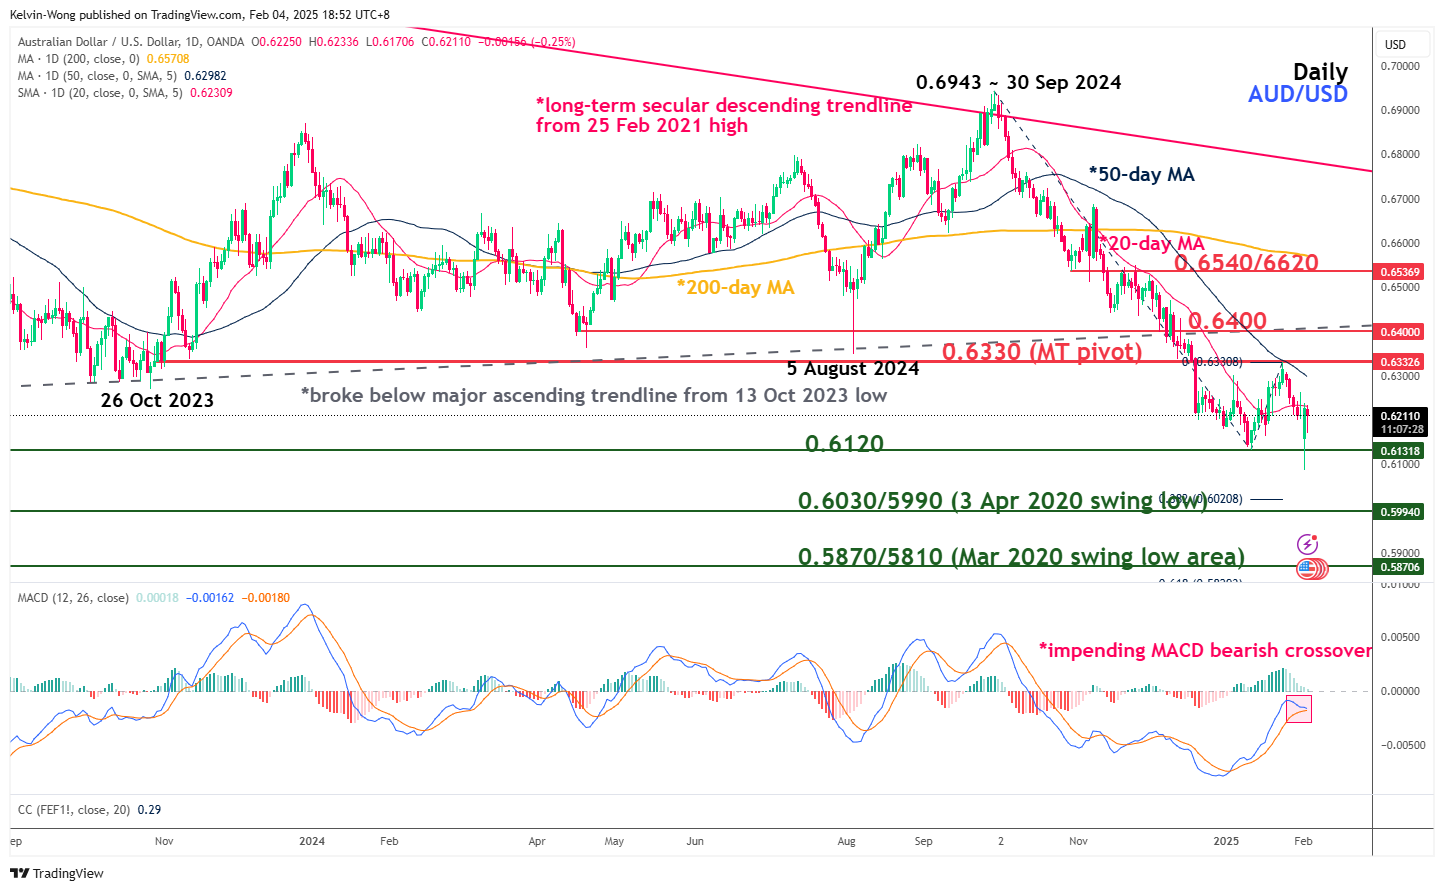
The recent rebound seen in the AUD/USD from its recent 13 January swing low area has been stalled right at its downward sloping 50-day moving average that has acted as a resistance at around 0.6330 (see Fig 1).
Coupled with an impending bearish crossover condition being flashed out today, 3 February by the daily MACD trend indicator below its centreline suggests that the medium-term downtrend of the AUD/USD in place since its 30 September 2024 swing high of 0.6943 remains intact.
Watch the 0.6330 key medium-term pivotal resistance and a break with a daily close below 0.6120 key near-term support exposes the next medium-term supports of 0.6030/5990 and 0.5870/5810.
On the flip side, a clearance above 0.6330 invalidates the bearish scenario for the next medium-term resistance to come in at 0.6440, and above it sees the long-term pivotal resistance of 0.6540/6620 (also the 200-day moving average).
USD/CAD Hit Overbought Condition but No Clear Signs of Bearish Reversal

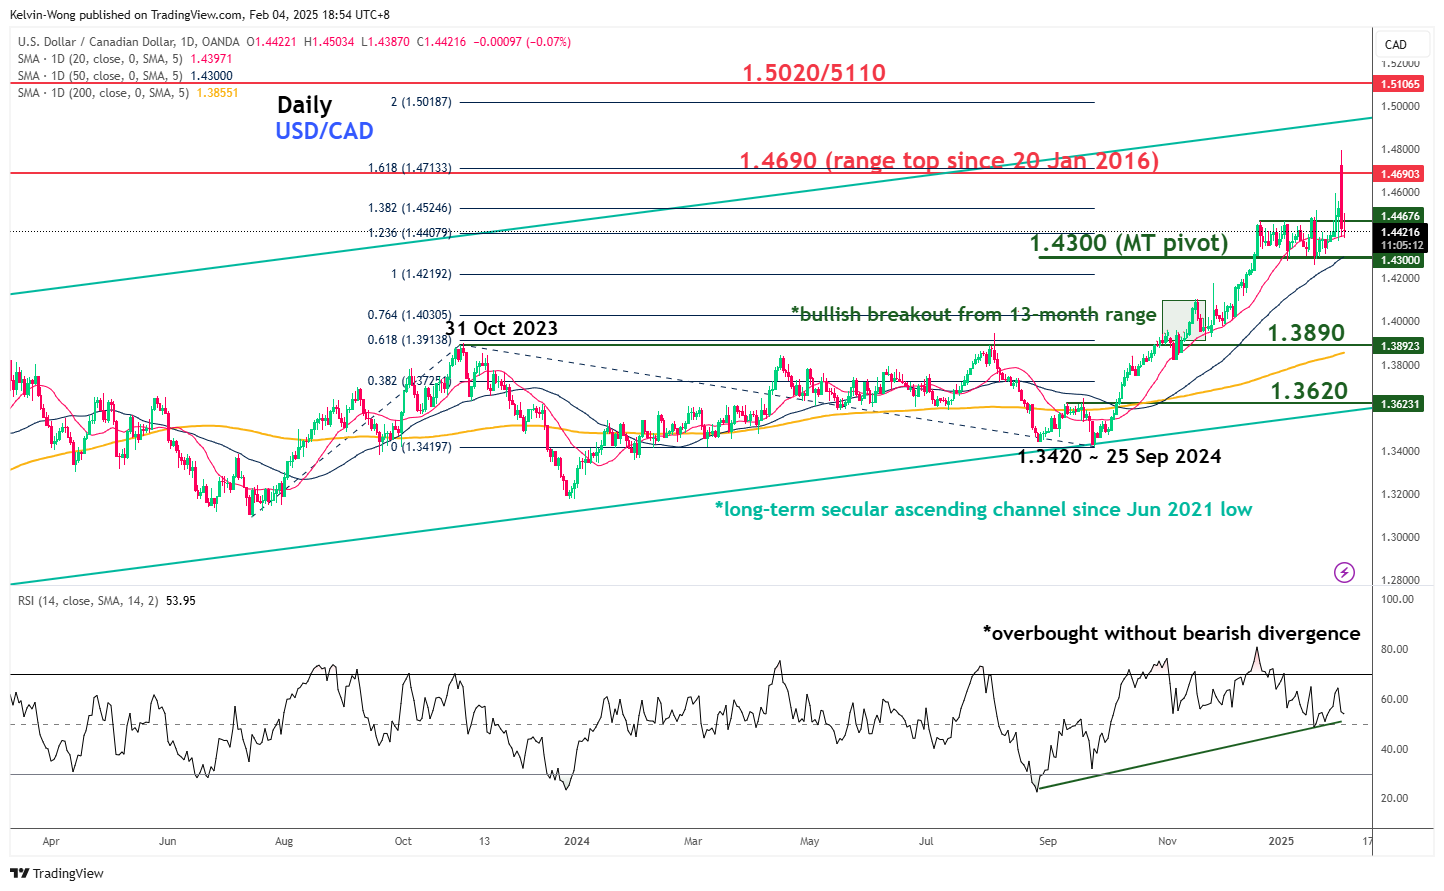
The price actions of the USD/CAD gapped up today 3 February and right now, it is testing its long-term secular range resistance of 1.4690 which has been in place since 20 January 2016.
The daily RSI momentum indicator has reached its overbought region but has not flashed out any bearish divergence condition which suggests that the USD/CAD may stage a minor pull at this juncture before resuming its impulsive upmove sequence within its current medium-term uptrend in place since 25 September 2024 swing low of 1.3420 (see Fig 2).
Watch the 1.4300 key medium-term pivotal support (also the 50-day moving average) to hold any potential minor pull-backs and a daily close above the 1.4690 key near-term resistance sees the next medium-term resistance coming in at 1.5020/5110 (also the upper boundary of the long-term secular ascending channel from June 2021 low).
However, a breakdown below 1.4300 invalidates the bullish scenario on the USD/CAD for a potential corrective decline sequence to unfold within its major uptrend phase which exposes the next medium-term support at 1.3890 (also the 200-day moving average in the first step).
Original Post
