
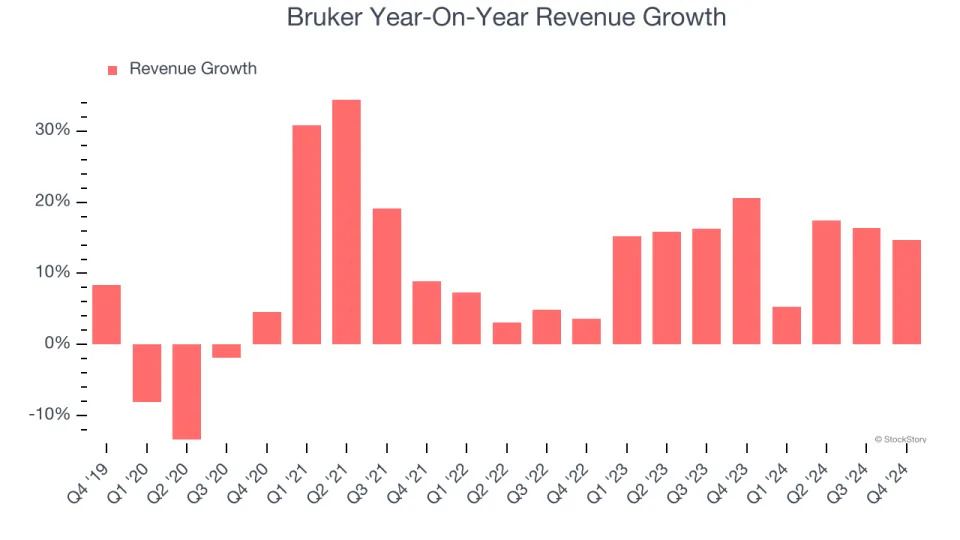
Scientific instrument company Bruker (NASDAQ:BRKR). reported Q4 CY2024 results exceeding the market’s revenue expectations , with sales up 14.6% year on year to $979.6 million. On the other hand, the company’s full-year revenue guidance of $3.51 billion at the midpoint came in 1.8% below analysts’ estimates. Its non-GAAP profit of $0.76 per share was 3.2% above analysts’ consensus estimates.
Is now the time to buy Bruker? Find out in our full research report .
Bruker (BRKR) Q4 CY2024 Highlights:
Frank H. Laukien, Bruker’s President and CEO, commented: “The year 2024 was transformational for Bruker. We completed several strategic acquisitions to access very large addressable markets with strong secular tailwinds. In the process, we added key spatial biology, molecular diagnostics and lab automation platforms to our portfolio. For the fourth year in a row, Bruker has delivered well above-market organic and double-digit CER revenue growth. With approximately 70% cumulative revenue growth in the last four years, we have now achieved significant scale.”
Company Overview
Founded in 1960, Bruker (NASDAQ:BRKR) designs and manufactures high-performance scientific instruments and analytical solutions for molecular and material research, diagnostics, and industrial applications.
Research Tools & Consumables
The life sciences subsector specializing in research tools and consumables enables scientific discoveries across academia, biotechnology, and pharmaceuticals. These firms supply a wide range of essential laboratory products, ensuring a recurring revenue stream through repeat purchases and replenishment. Their business models benefit from strong customer loyalty, a diversified product portfolio, and exposure to both the research and clinical markets. However, challenges include high R&D investment to maintain technological leadership, pricing pressures from budget-conscious institutions, and vulnerability to fluctuations in research funding cycles. Looking ahead, this subsector stands to benefit from tailwinds such as growing demand for tools supporting emerging fields like synthetic biology and personalized medicine. There is also a rise in automation and AI-driven solutions in laboratories that could create new opportunities to sell tools and consumables. Nevertheless, headwinds exist. These companies tend to be at the mercy of supply chain disruptions and sensitivity to macroeconomic conditions that impact funding for research initiatives.
Sales Growth
A company’s long-term performance is an indicator of its overall quality. While any business can experience short-term success, top-performing ones enjoy sustained growth for years. Luckily, Bruker’s sales grew at a decent 10.2% compounded annual growth rate over the last five years. Its growth was slightly above the average healthcare company and shows its offerings resonate with customers.
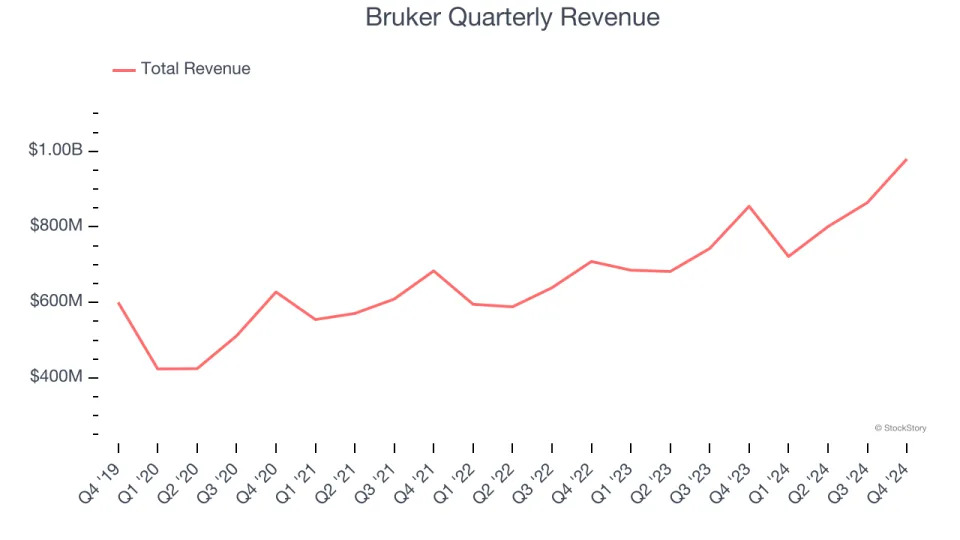
Long-term growth is the most important, but within healthcare, a half-decade historical view may miss new innovations or demand cycles. Bruker’s annualized revenue growth of 15.3% over the last two years is above its five-year trend, suggesting its demand recently accelerated.
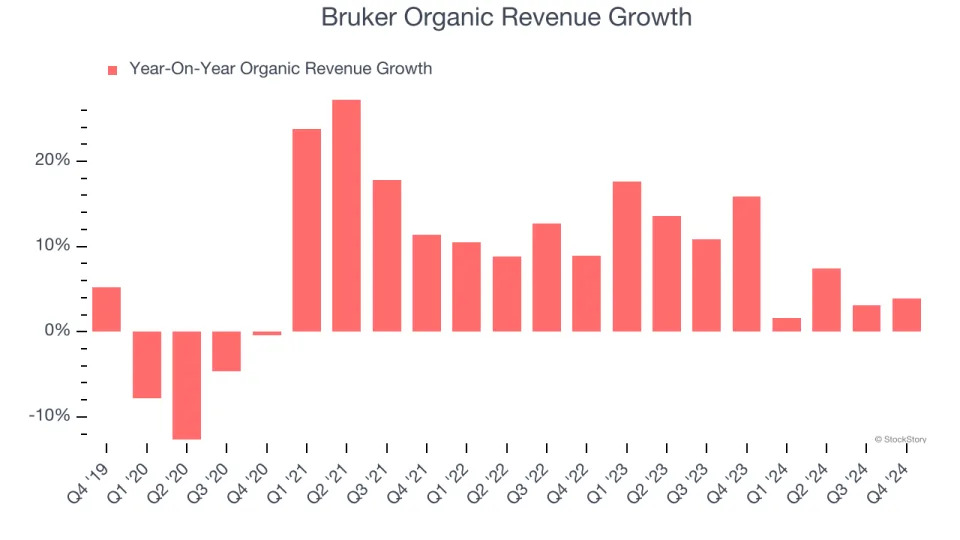
We can better understand the company’s sales dynamics by analyzing its organic revenue, which strips out one-time events like acquisitions and currency fluctuations that don’t accurately reflect its fundamentals. Over the last two years, Bruker’s organic revenue averaged 9.2% year-on-year growth. Because this number is lower than its normal revenue growth, we can see that some mixture of acquisitions and foreign exchange rates boosted its headline results.
This quarter, Bruker reported year-on-year revenue growth of 14.6%, and its $979.6 million of revenue exceeded Wall Street’s estimates by 1.4%.
Looking ahead, sell-side analysts expect revenue to grow 5.5% over the next 12 months, a deceleration versus the last two years. Despite the slowdown, this projection is above average for the sector and suggests the market sees some success for its newer products and services.
Software is eating the world and there is virtually no industry left that has been untouched by it. That drives increasing demand for tools helping software developers do their jobs, whether it be monitoring critical cloud infrastructure, integrating audio and video functionality, or ensuring smooth content streaming. .
Operating Margin
Bruker has done a decent job managing its cost base over the last five years. The company has produced an average operating margin of 14.7%, higher than the broader healthcare sector.
Analyzing the trend in its profitability, Bruker’s operating margin decreased by 3.9 percentage points over the last five years. This performance was caused by more recent speed bumps as the company’s margin fell by 8.6 percentage points on a two-year basis. We’re disappointed in these results because it shows operating expenses were rising and it couldn’t pass those costs onto its customers.
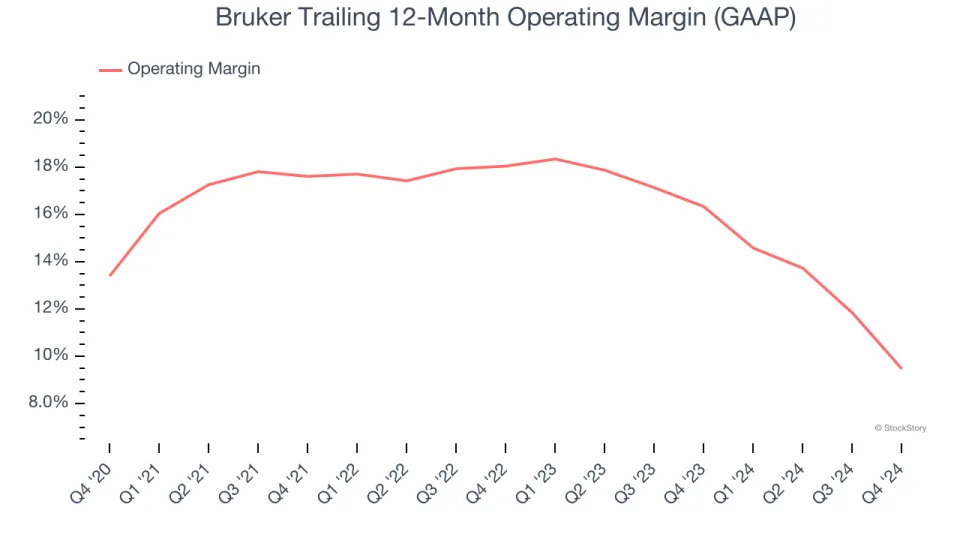
This quarter, Bruker generated an operating profit margin of 7.4%, down 8.7 percentage points year on year. This contraction shows it was recently less efficient because its expenses grew faster than its revenue.
Earnings Per Share
We track the long-term change in earnings per share (EPS) for the same reason as long-term revenue growth. Compared to revenue, however, EPS highlights whether a company’s growth is profitable.
Bruker’s EPS grew at a solid 8.9% compounded annual growth rate over the last five years. However, this performance was lower than its 10.2% annualized revenue growth, telling us the company became less profitable on a per-share basis as it expanded due to non-fundamental factors such as interest expenses and taxes.
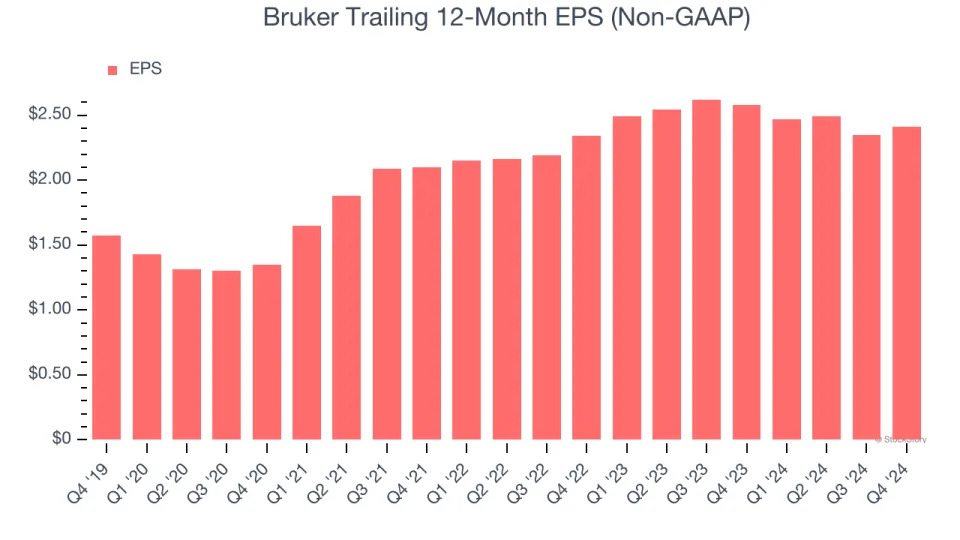
Diving into the nuances of Bruker’s earnings can give us a better understanding of its performance. As we mentioned earlier, Bruker’s operating margin declined by 3.9 percentage points over the last five years. This was the most relevant factor (aside from the revenue impact) behind its lower earnings; taxes and interest expenses can also affect EPS but don’t tell us as much about a company’s fundamentals.
In Q4, Bruker reported EPS at $0.76, up from $0.70 in the same quarter last year. This print beat analysts’ estimates by 3.2%. Over the next 12 months, Wall Street expects Bruker’s full-year EPS of $2.41 to grow 10.7%.
Key Takeaways from Bruker’s Q4 Results
It was good to see Bruker top analysts’ organic revenue and EPS expectations this quarter. On the other hand, its full-year revenue guidance missed Wall Street’s estimates. Overall, this was a weaker quarter due to the soft outlook, but the stock traded up 3% to $53.25 immediately following the results.
Big picture, is Bruker a buy here and now? When making that decision, it’s important to consider its valuation, business qualities, as well as what has happened in the latest quarter. We cover that in our actionable full research report which you can read here, it’s free .