The S&P Case-Shiller national home price index came in slightly below expectations, with a 0.1% decrease for the month of September.
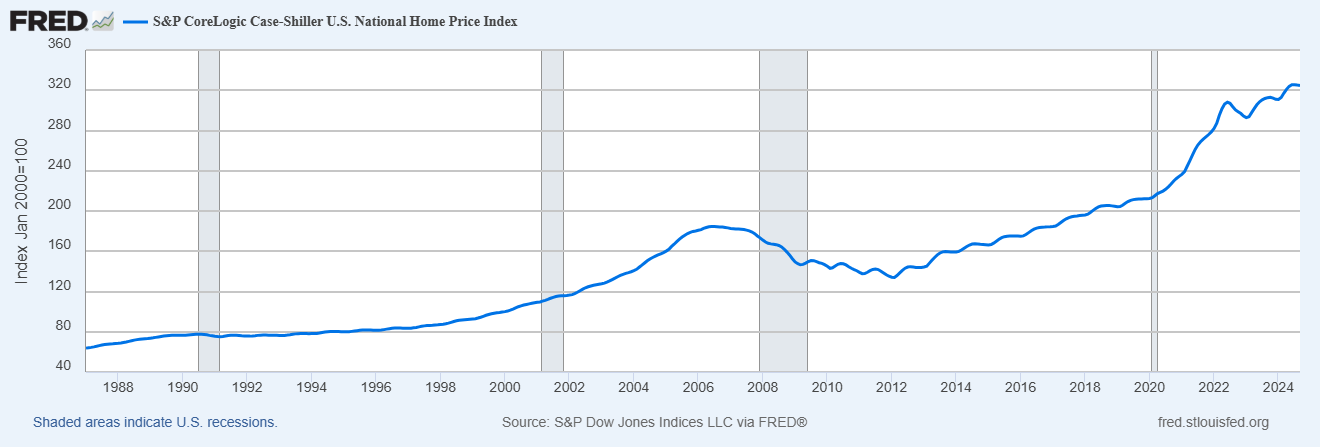
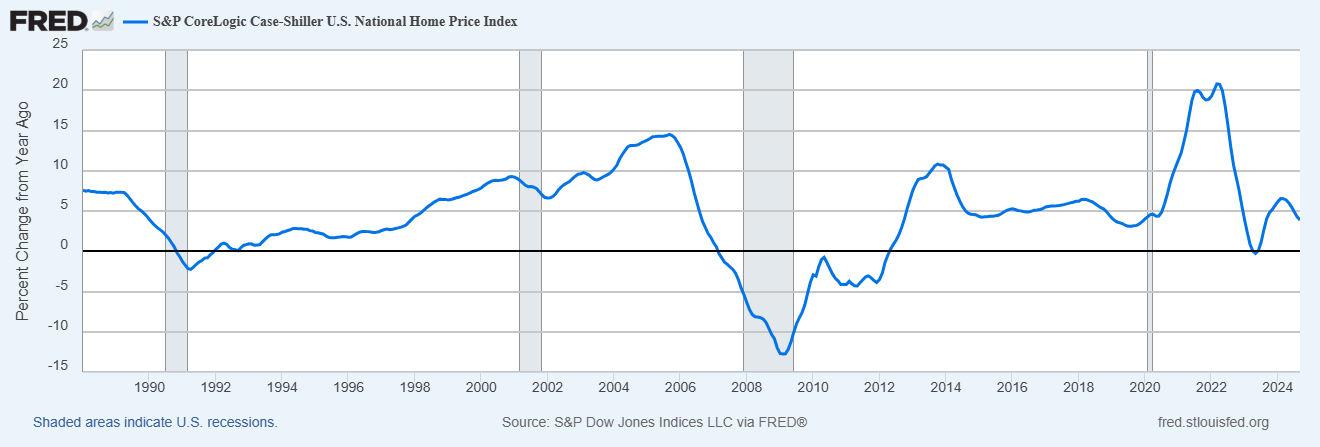
The index has gained +3.9% over the last 12 months, down from +4.3% last month. The gains were broad based nationwide.
“Home price growth stalled in the third quarter, after a steady start to 2024,” says Brian D. Luke, CFA, Head of Commodities, Real & Digital Assets. “The slight downtick could be attributed to technical factors as the seasonally adjusted figures boasted a 16th consecutive all-time high.
“We continue to see above-trend price growth in the Northeast and Midwest, growing 5.7% and 5.4%, respectively, led by New York, Cleveland, and Chicago,” Luke continued. “The Big Apple (NASDAQ:
AAPL
) has taken the top spot for five consecutive months, pushing the region ahead of all others since August 2023. The South region reported its slowest growth in over a year, rising 2.8%, barely above current inflation levels.”
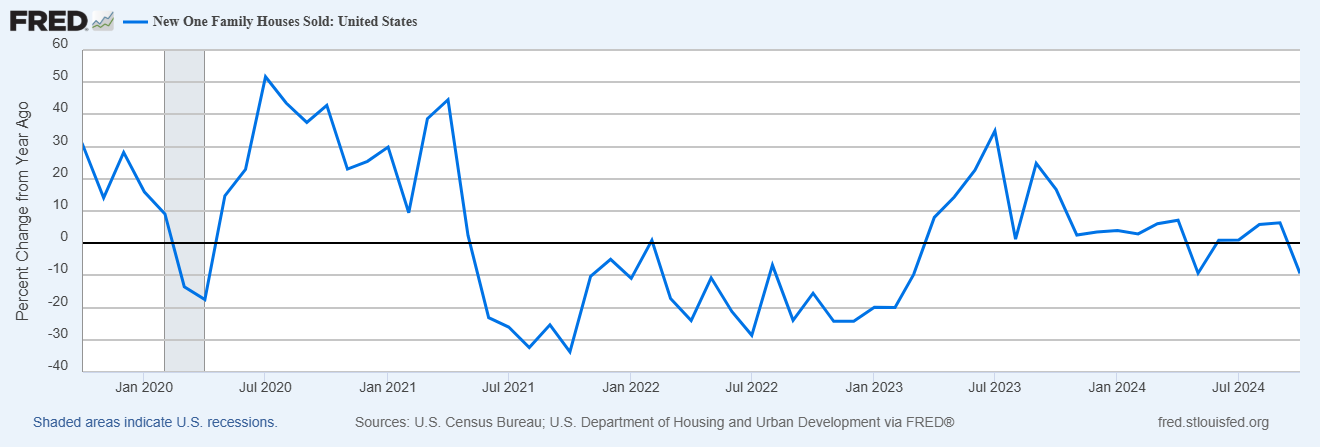
New home sales came in at an annualized rate of 610K units sold for the month of October. Well below street expectations of 725K, a 17.3% decline for the month (the worst one month decline since July 2013). And down 41% from the October 2020 peak of 1,031K.
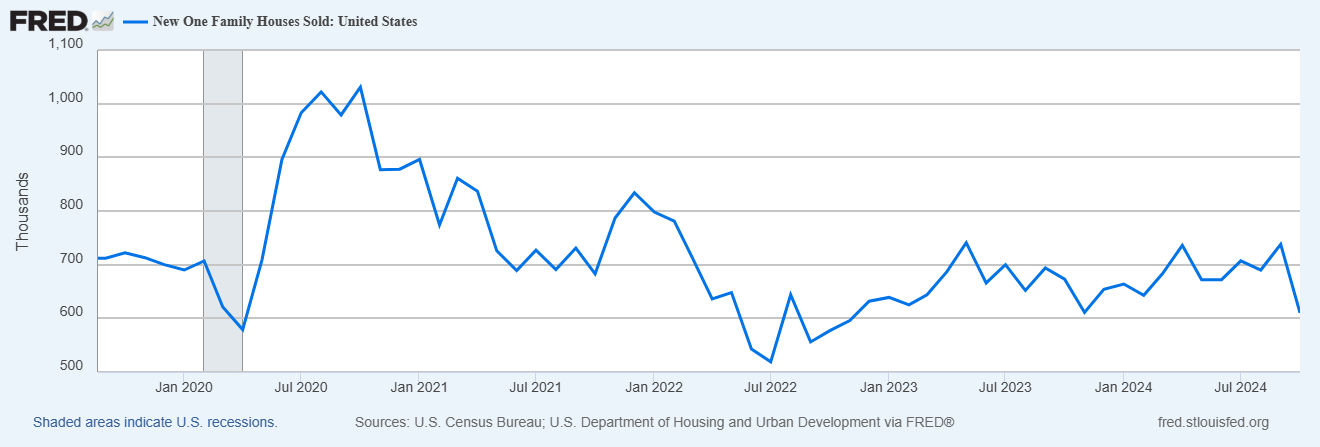
New home sales are down -9.4% over the last 12 months ending in October, a reversal from the +6.3% gain at the end of September.
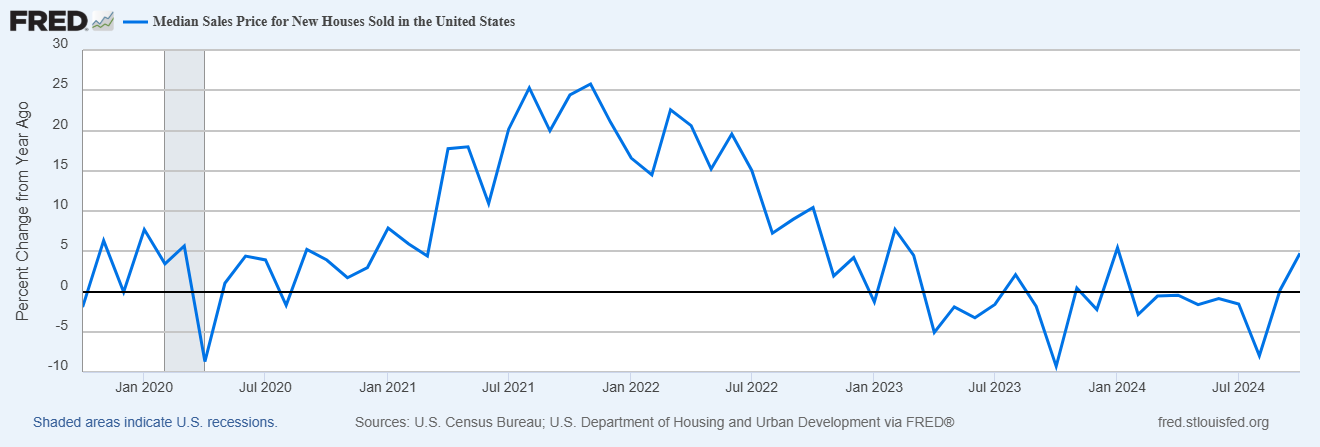
The median sales price for new homes sold increased to $437,300, which is an increase of +2.5% for the month. Median prices are still down about 5% from their October 2020 highs.
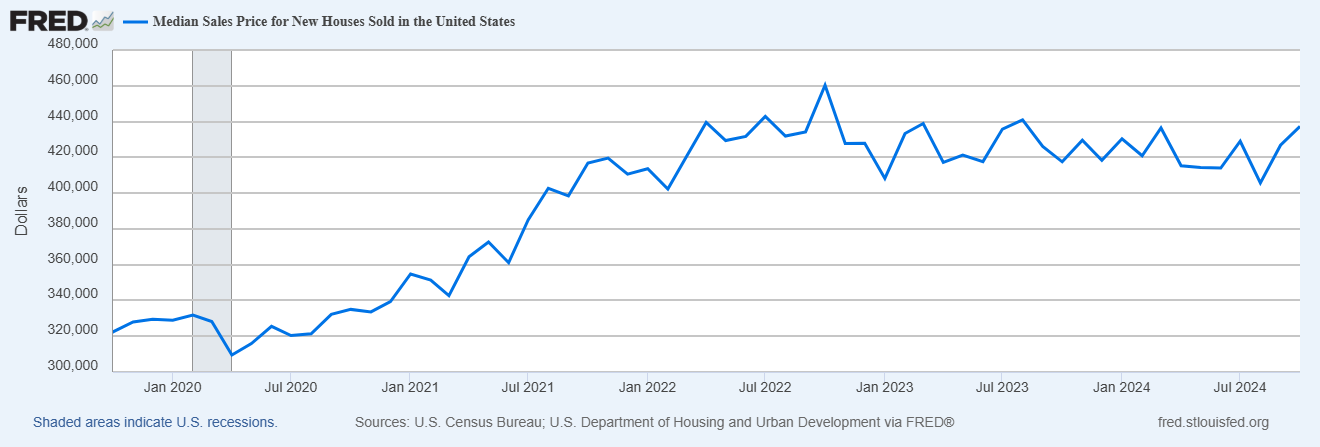
Prices for new homes are up +4.7% over the last 12 months, an acceleration for the +0.2% annualized increase ending in the month of September.
Sales down, but prices are up? It’s a complicated dynamic between higher interest rates, supply & demand, and the types of new homes being built. New home sales used to be a pretty reliable leading indicator, but has since decoupled from the economy a bit since the great reset in interest rates and COIVD stimulus. It’s still important and worth following.
